Reading results
The bottom panel populates as a mobile run executes — the same tabs as web, with a couple of mobile-native twists.
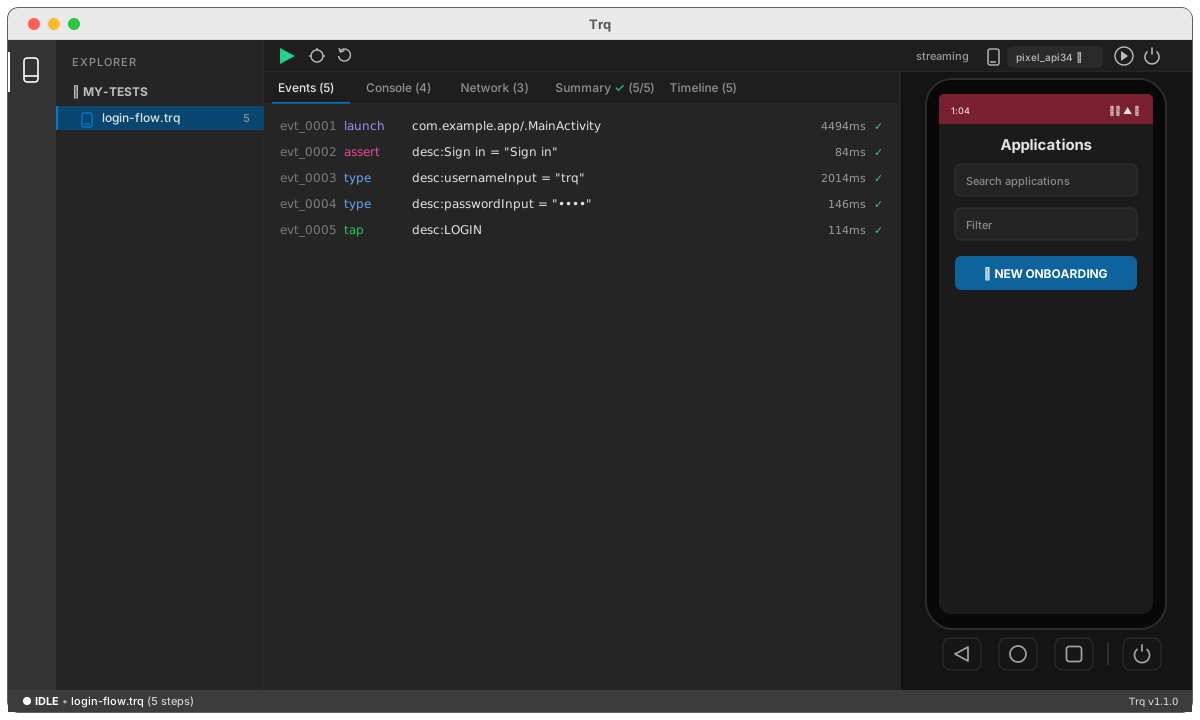
Events
Every step with its type, target, timing, and pass/fail status. A step that passed only after a retry shows an amber ↻ flaky badge instead of a green ✓. Double-click a row to edit it.
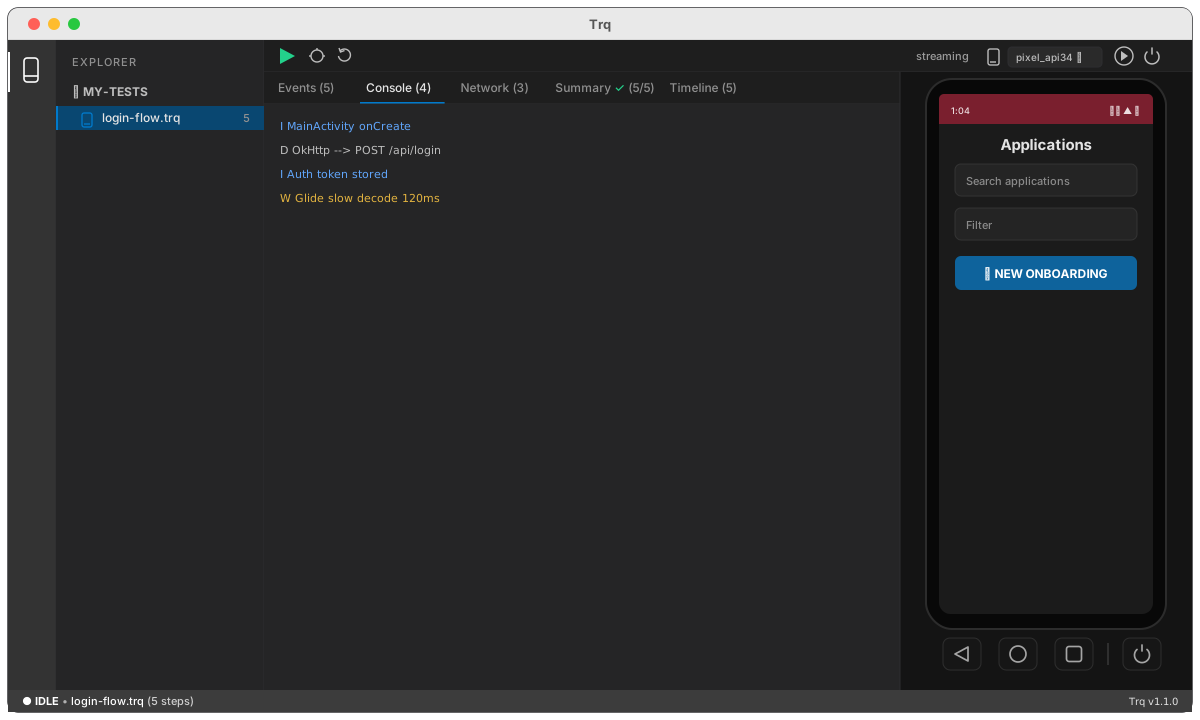
Console
The app's logcat, filtered to the app under test and coloured by level (DEBUG / INFO / WARN / ERROR) — the mobile analog of a page console.
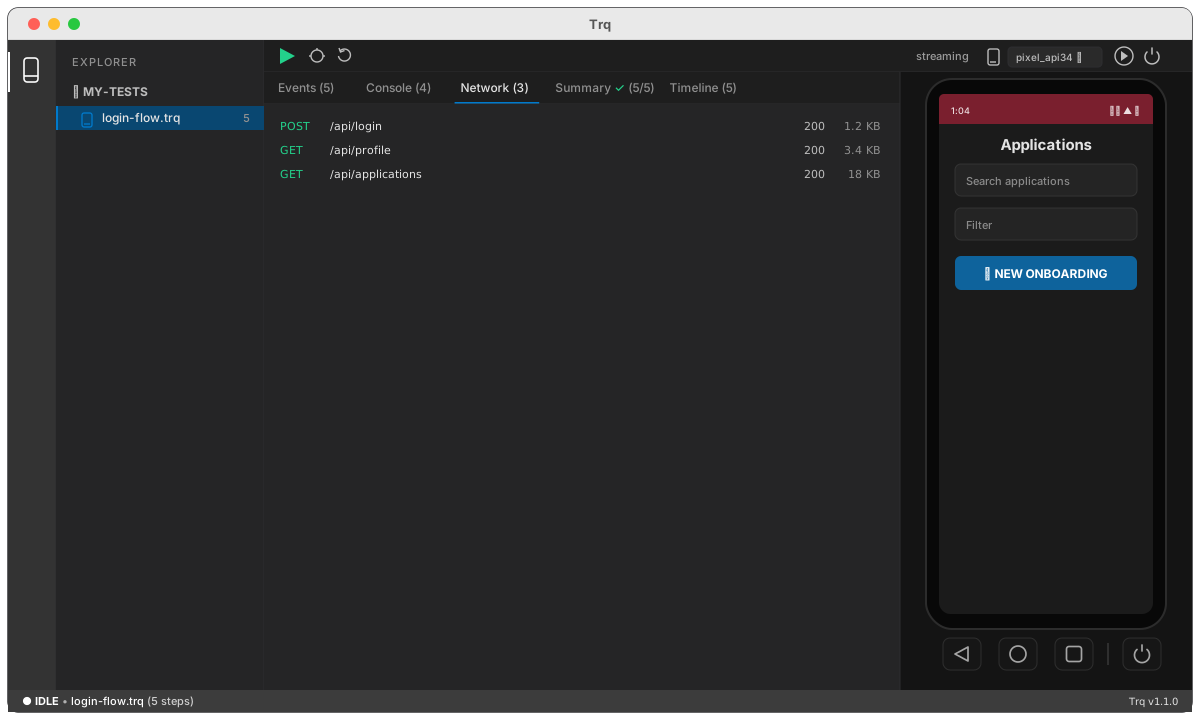
Network
The app's network calls in a familiar request inspector — method, status, size, and timing, with Headers / Payload / Response / Timing on click. See network capture for what's captured and the HTTPS story.
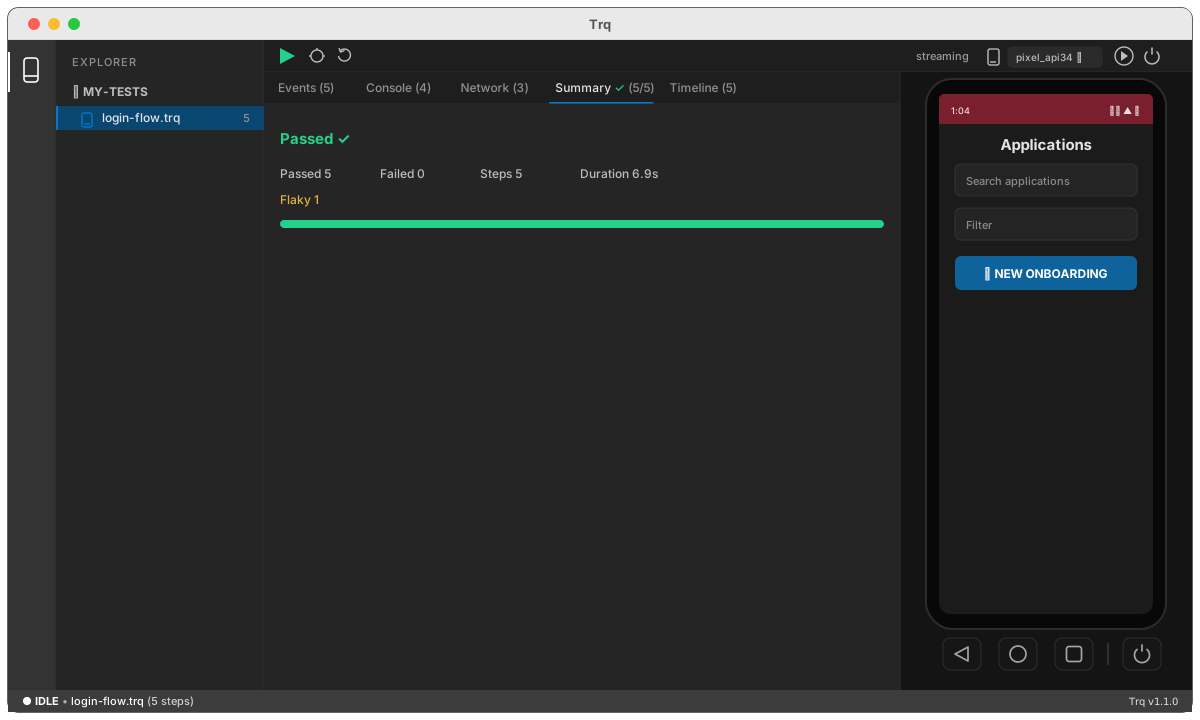
Summary
Pass/fail counts, total duration, the slowest step, a Flaky count, and the failure screenshot if the run stopped — plus Share run to export the whole run (share a run).
Timeline
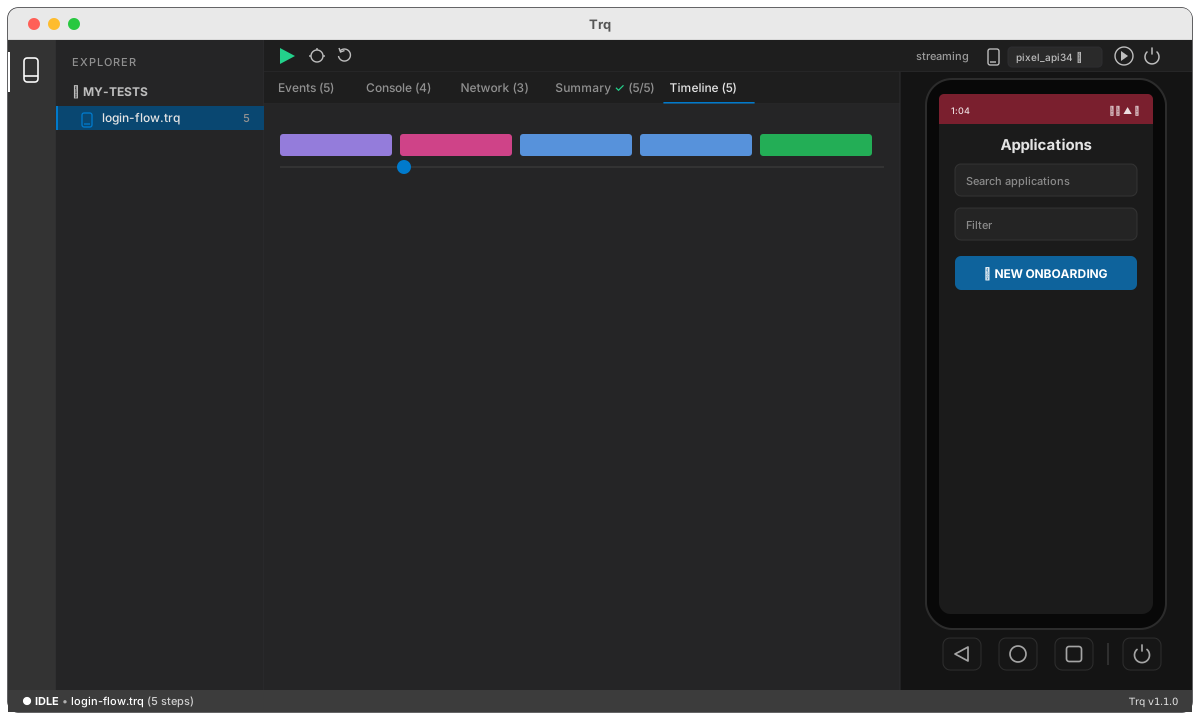
A scrubber over time-scaled bars (coloured by step type); each step also captured a screenshot, so you can see what the screen looked like at each point.
Results stay put
A run's results — the step outcomes, the console, the network table, the summary and the timeline screenshots — survive switching away from the session. Open another file in the explorer, come back, and the last run is still there, exactly as you left it.
They are replaced when you run that session again, and not before. Nothing is cleared by switching, closing a panel, or reopening a project.
Results also survive restarting Trq: they are written under .trq/runs/ in
the project, one file per session, and read back when you reopen it. That folder
is gitignored for you.
The last run of up to 12 sessions is kept. Beyond that, the least recently run is dropped — the results are a convenience, not an archive. For a record that lasts, use the HTML report a CLI run writes.
When a result no longer matches
Editing a session invalidates its retained result: step numbers move when steps are added, removed or reordered, so a report pinned to the old numbering would point at the wrong rows. Trq notices and marks the result stale rather than showing you something that silently misreads.