Run reports
Every Run fills the Summary tab in the bottom panel with an industry-standard report: a verdict up top, headline stats, failures first, then a per-request breakdown you can expand. It's the same reporting shape as web and mobile runs.
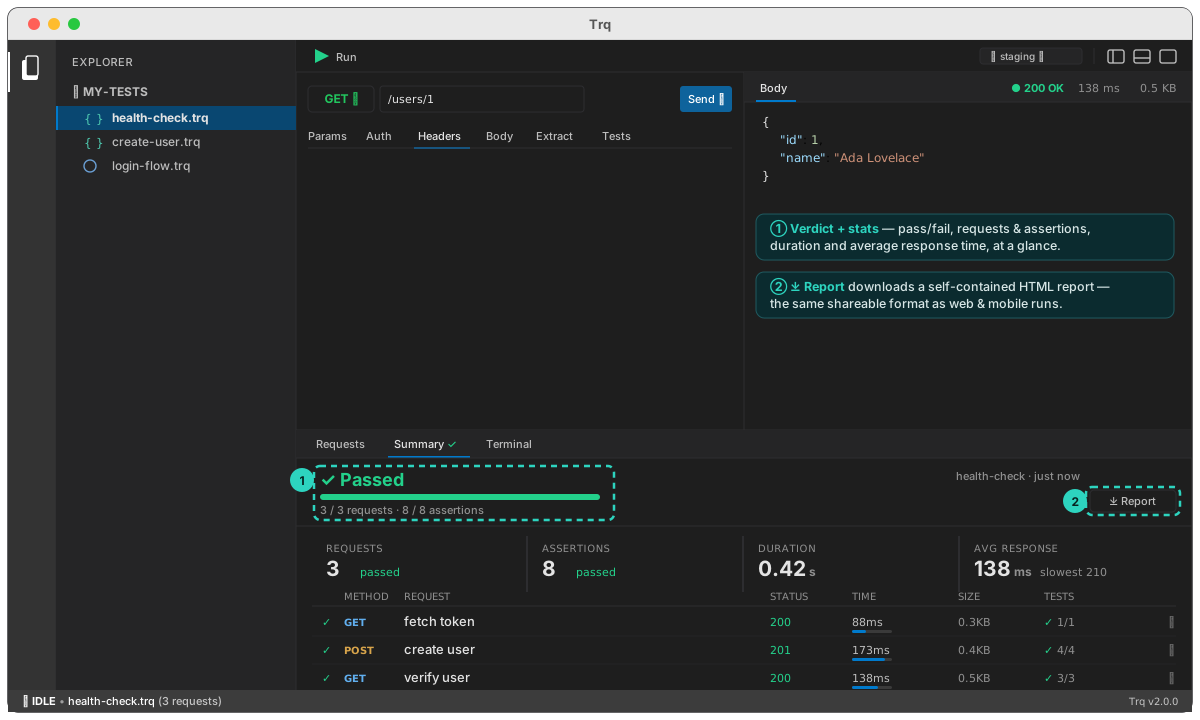
What's in it
- Verdict banner — a big ✓ Passed / ✗ Failed, a progress bar, and the tally: requests passed and assertions passed, with the session name and run time.
- Stat cards — Requests, Assertions, Duration, and Avg response (with the slowest request called out).
- Failures first — if anything failed, a block lists each failure (request · assertion · actual value) at the top, so you don't hunt for it.
- Per-request table — one row per request: method, name, status, time (with a mini response-time bar), size, and its assertion count. Expand a row to see its assertions, extracted variables, and a response-body preview.
Download an HTML report
Click ⤓ Report in the Summary tab to save the whole run as one self-contained HTML file — no server, no assets, nothing to install. Open it in any browser, attach it to a ticket, or publish it as a CI artifact. It's the same shareable format the web and mobile runs produce, so a mixed suite reports uniformly.
The CLI reports too
Running a case from the trq CLI prints per-request pass/fail and can emit machine-readable reporters for CI — see the CLI docs.
Next: run it headlessly in CI.